What Is a Yield Curve?
Every so often a single graph makes financial headlines all on its own. When that happens, it is usually the yield curve — a line that traders, economists and central bankers all watch for hints about where the economy is heading next.
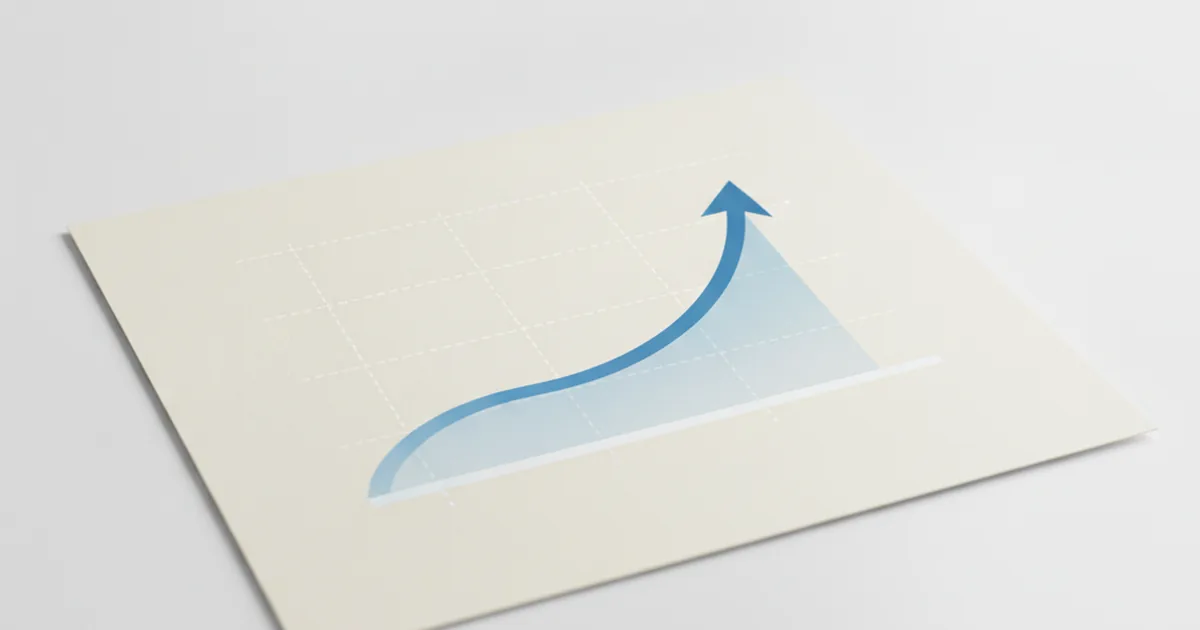
If you have not yet met bonds, that is the natural place to start — a yield curve is really just several bonds from the same borrower, lined up side by side. Once you know that a bond is a loan with a fixed coupon and a repayment date, the yield curve is simply a way of asking the same question at lots of different repayment dates at once: how much interest does the market demand for lending money for three months, versus two years, versus thirty?
The answers to that question, plotted on a graph, form a curve. Its shape changes all the time, and each shape tells a slightly different story about what investors expect from the economy.
TL;DR: A yield curve plots government bond yields against how long each bond has left to run. A normal, upward-sloping curve suggests a healthy, growing economy. A flat curve signals uncertainty. An inverted curve, where short-term yields sit above long-term ones, has historically been an early warning sign of a slowdown.
What is a yield curve?
A yield curve is a graph that shows the interest rate, or yield, paid by bonds from the same issuer across a range of maturities — from a few months out to thirty years or more. Each point on the curve represents one bond: a three-month bond here, a ten-year bond there, a thirty-year bond further along.
Curves are almost always built from government bonds rather than company bonds, and there is a good reason for that. A government's bonds all carry roughly the same credit risk, since they are backed by the same borrower. That means any difference in yield along the curve is not about trust in the borrower — it is purely about time. Comparing bonds this way isolates one variable: how much extra return investors want for locking their money away for longer.
How do you read the graph?
The layout is simple once you have seen it once. The horizontal axis runs from short maturities on the left (three months, six months, two years) to long maturities on the right (ten years, twenty years, thirty years). The vertical axis is the yield, shown as a percentage.
Each bond on offer becomes a single dot: find its time to maturity along the bottom, its yield up the side, and mark the spot. Join the dots from short to long, and you have the curve. If you have already read our guide to what a yield actually is, this is the same idea applied across a whole range of maturities rather than just one bond in isolation.
The three shapes of a yield curve
A curve can take roughly three shapes, and each one is read as a different signal by the market.
Normal (upward-sloping)
Longer-dated bonds pay more than shorter ones. This is the shape you would expect most of the time: lending money for thirty years ties it up for far longer than lending it for three months, so investors want extra reward, called a term premium, for that wait. A normal curve usually goes hand in hand with a steadily growing economy and unremarkable expectations for future interest rates.
Flat
Short and long yields sit close together, with barely any slope at all. This tends to show up when investors are unsure what comes next — perhaps a central bank has been raising rates and the market cannot decide whether more hikes, a pause, or cuts are coming. A flat curve is often described as a curve caught between two stories.
Inverted (downward-sloping)
Short-term yields climb above long-term ones. This is the shape that makes headlines, because it usually means investors expect interest rates to fall in the future, most often because they think the economy is about to slow down. An inverted curve has preceded a number of past recessions, which is why it gets watched so closely — more on that below.
| Shape | Short-term vs long-term yield | What it usually signals |
|---|---|---|
| Normal | Short lower than long | Steady growth, unremarkable rate outlook |
| Flat | Short and long about equal | Uncertainty about what happens next |
| Inverted | Short higher than long | Market expects rate cuts, possible slowdown ahead |
Why does the yield curve matter for investors?
The curve is essentially the bond market's collective forecast, expressed in prices rather than words. Every yield on it reflects what thousands of buyers and sellers currently believe about future interest rate decisions from the central bank and about future inflation. When a central bank such as the Bank of England is expected to cut its Bank Rate, that expectation shows up first in falling short-term yields, well before any actual cut is announced.
That forward-looking quality is exactly why the curve matters beyond the bond market itself. It is one of the few widely watched indicators that tries to look ahead rather than just report what already happened. Economists cross-check it against employment figures, spending data and inflation reports, rather than trusting it alone — a healthy habit, since the curve, like any single indicator, gets things wrong sometimes.
UK gilts and the yield curve
In the UK, government bonds are called gilts, and they are issued by the UK Debt Management Office (DMO) on behalf of the government. Because gilts are treated as close to risk-free within the UK market, their yield curve is the standard reference point that other UK borrowing costs, from mortgages to company bonds, tend to be measured against.
The short end of the gilt curve is especially sensitive to the Bank of England's Bank Rate decisions and to what investors expect the Bank to do next. The longer end responds more to expectations about inflation over many years and to steady demand from pension funds, which need long-dated, reliable income to match payouts stretching decades into the future. When gilt yields moved sharply in recent times, as covered in our piece on UK gilt yields hitting an 18-year high, it was this same curve, and the same forces along it, that were shifting underneath the headline.
What does an inverted yield curve mean?
An inversion happens when investors, as a group, expect the central bank to cut interest rates down the road, usually because they anticipate slower growth or a recession. Long-term bonds lock in today's yield for years, so if buyers believe rates are heading lower, they are willing to accept a lower yield now to secure it before it drops further. That pushes long-term yields down even as short-term yields, still anchored to today's higher Bank Rate, stay elevated. The result is a curve that slopes the "wrong" way.
It is worth being precise about what this does and does not tell you. An inverted curve has come before several past recessions, sometimes by many months and sometimes by a couple of years, which is why it earns so much attention. But it is not a perfect predictor, and there have been inversions that were not followed by a downturn at all. Treat it as one useful signal among several, not a crystal ball.
What this means for your Challenge portfolio
You will not be trading bonds directly in the Student Investor Challenge, but the yield curve is exactly the sort of thing that shows up in financial news while you are running your virtual £100,000 portfolio. Knowing what it means gives you useful context: if headlines mention an inverted curve, you will understand that the bond market is signalling caution about growth, which can help explain why certain sectors or company shares move the way they do. It is not a signal to buy or sell anything — just one more piece of the picture, alongside everything else you track on the league table as the season goes on.
FAQ
What is a yield curve in simple terms?
A yield curve is a graph that plots the interest rate, or yield, paid by a government's bonds against how long each bond has left until it matures, from a few months out to thirty years. It gives you a snapshot of what the market expects to happen to interest rates and the economy over time, all on one line.
Why does a yield curve invert?
A curve inverts when investors expect a central bank to cut interest rates in the future, usually because they think growth is slowing or a recession is coming. That expectation pulls long-term yields down below short-term ones, because long-term bonds lock in today's rate for years, and buyers are happy to accept less now if they believe rates are about to fall anyway.
Is an inverted yield curve always followed by a recession?
No. An inversion has come before several past recessions, which is why it gets so much attention, but it is not a guarantee. The lag between an inversion and any downturn has varied from months to a couple of years, and there have been inversions that were not followed by a recession at all. It is a warning worth watching, not a certainty.
Where can I see the UK's current yield curve?
The UK Debt Management Office publishes gilt yield data, and the Bank of England's website tracks the Bank Rate that anchors the short end of the curve. Financial news sites also plot the gilt curve regularly whenever it makes headlines, such as during periods of unusually high or low yields.
Next time interest rates make the news, look for a mention of the yield curve — it is usually the quiet detail behind the loud headline. For the building blocks behind it, our guides to bonds and yields are the natural next stops.
Sources: Bank of England — monetary policy, UK Debt Management Office.
Learn it by playing it
Build a virtual £100,000 portfolio and see how markets react to real interest rate news — with none of your own money on the line.
See how it works