What Is Technical Analysis?
Charts, trends, and indicators — explained for beginners. Here is how to read a share price chart and use technical analysis alongside fundamental research in the Student Investor Challenge.
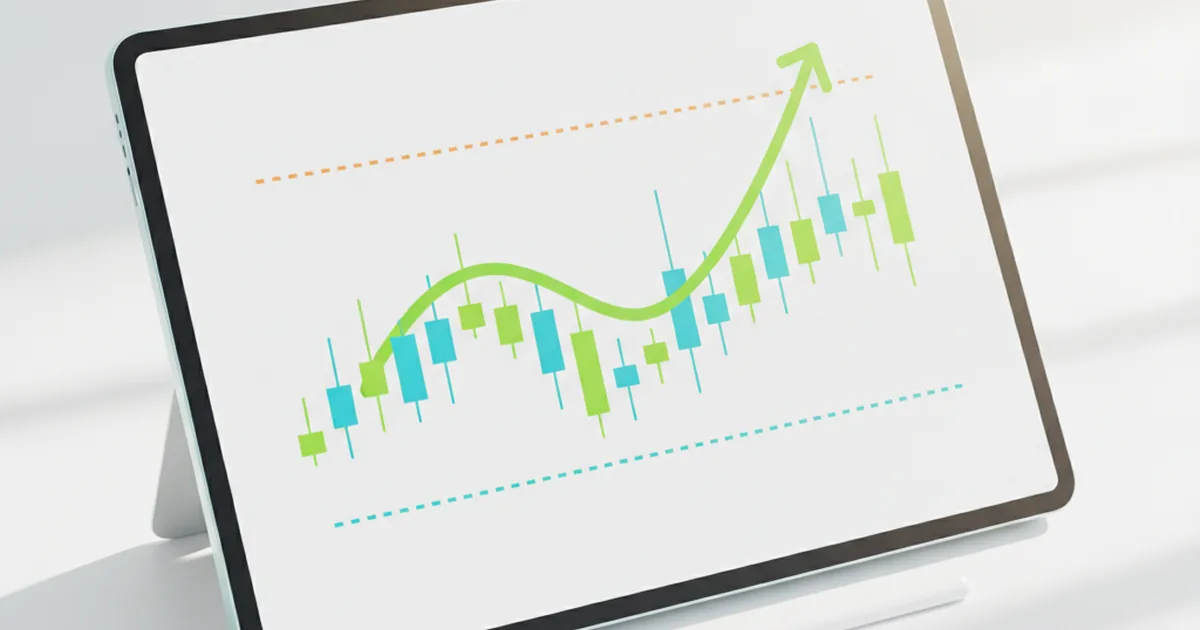
Have you ever glanced at a share price chart and noticed it has been climbing steadily for months, or keeps bouncing off the same low point every time it dips? If so, you have already been thinking like a technical analyst. When you compare a share’s chart to its business performance as covered in fundamental analysis, you start to see two very different but complementary pictures of the same investment.
Technical analysis is the study of price charts and trading patterns — not company accounts. Instead of asking whether a business is profitable, it asks where the share price is likely to go next based on past behaviour. Used alongside fundamental research, it helps investors judge timing and momentum.
What is the difference between technical analysis and fundamental analysis?
Both are tools for deciding whether to buy or sell a share, but they look at completely different information.
Fundamental analysis studies the company itself: its profits, revenue growth, debt, management quality, and whether the share price is fair relative to what the business actually earns. It asks “is this company worth owning?”
Technical analysis studies the share price chart: past price movements, patterns, and trading volume. It does not care what the company sells or how profitable it is — it only looks at what buyers and sellers have been doing with the price. It asks “where is the price likely to go next?”
Neither approach is universally better. Long-term investors tend to lean on fundamental analysis to decide what to buy; they use technical analysis to help decide when to buy it. In the Student Investor Challenge, you can use both.
| Fundamental analysis | Technical analysis | |
|---|---|---|
| Focus | Company finances and business quality | Price charts and trading patterns |
| Data used | Revenue, profit, P/E ratio, cash flow | Price, volume, moving averages, RSI |
| Time horizon | Months to years | Days to weeks (often) |
| Best used for | Deciding what to buy | Deciding when to buy or sell |
What do the different chart types show?
Before you can read indicators, you need to choose a chart type. Each one displays the same price data in a different way.
Line charts
The simplest option: a single line connecting each day’s closing price. Line charts are excellent for spotting the overall trend at a glance — is the share broadly rising, falling, or moving sideways? They sacrifice detail for clarity, which makes them a good starting point for beginners.
Bar charts
Bar charts show four prices for each period: the open, the high, the low, and the close (often abbreviated as OHLC). A small tick on the left of each bar marks the opening price; a small tick on the right marks the closing price. You get more information per period than a line chart, without being too complicated to read.
Candlestick charts
Candlestick charts are the most popular among traders worldwide. Each “candle” has a rectangular body (spanning the open-to-close range) and thin lines called wicks (showing the session high and low). If the closing price was higher than the opening price, the body is typically green or white — a “bullish” candle. If the close was lower than the open, it is red or black — a “bearish” candle.
Specific patterns formed by one or more candles (such as a “doji” or an “engulfing” pattern) are used by traders to anticipate short-term reversals. You do not need to memorise every pattern to get value from candlestick charts — even the basic colour-coded bodies tell a story about who was in control during the session.
What are support and resistance levels?
Support and resistance are among the most widely used concepts in technical analysis, and they relate directly to the volatility of a share — how much the price moves around.
Support is a price floor: a level at which a share has repeatedly stopped falling and bounced back upward. Buyers step in at this level, because they see the share as good value there. If a FTSE 100 share has bounced three times off 500p over the course of a year, that 500p level is considered strong support.
Resistance is a price ceiling: a level at which a share repeatedly stalls or reverses. Sellers appear at this level, taking their profits or betting the price will fall.
Why do traders care? Because these levels are self-reinforcing. When enough traders watch the same chart and act on the same levels, the levels become real — support holds because buyers buy there; resistance holds because sellers sell there. A share that breaks above a resistance level is often seen as a bullish signal, because it suggests buyers have overwhelmed all the sellers. A share that falls through support is often bearish.
How do you spot a trend?
One of the most foundational ideas in technical analysis is that prices tend to move in trends, and that trends persist longer than you might expect. Identifying whether a share is in an uptrend, downtrend, or moving sideways is the first question a technical analyst answers.
- Uptrend: the chart shows a series of higher highs and higher lows. Each peak is higher than the last; each trough is also higher than the last. This is the signature of sustained buying pressure.
- Downtrend: the opposite — lower highs and lower lows. Each peak and trough is lower than the one before it, reflecting persistent selling pressure.
- Sideways (consolidation): the price oscillates within a fairly narrow range without making meaningful progress in either direction. This often happens before a breakout — but you do not know in advance which direction the breakout will go.
The old saying in trading is “the trend is your friend.” A share in a clear uptrend attracts momentum buyers, which can amplify the move further upward. A share in a downtrend tends to attract more sellers for the same reason. This does not mean trends last forever — they end — but it does mean it is usually safer to buy a share trending upward than one trending down.
Three indicators every beginner should know
Indicators are calculations applied to price or volume data to help measure momentum, identify trends, or signal when a share may have moved too far in one direction. There are hundreds of them, but these three cover most of what a beginner needs.
Moving averages (MA)
A moving average smooths out price data by averaging the closing price over a set number of days. The 50-day moving average (50 MA) takes the average closing price over the last 50 trading days; the 200-day MA does the same over 200 days. Because it averages out short-term noise, a moving average makes the underlying trend cleaner and easier to see.
Two particularly watched signals:
- Golden cross: when the 50-day MA crosses above the 200-day MA. Many traders see this as a bullish signal, suggesting short-term momentum has turned upward.
- Death cross: when the 50-day MA crosses below the 200-day MA — a bearish signal that short-term momentum has deteriorated. You can find free interactive charts with moving averages on the London Stock Exchange website.
Relative Strength Index (RSI)
The RSI is a momentum oscillator that moves between 0 and 100. It measures the speed and size of recent price moves to judge whether a share is “overbought” or “oversold.”
- RSI above 70: the share is considered overbought — it has risen quickly, and a pullback is possible (though not guaranteed).
- RSI below 30: the share is considered oversold — it has fallen sharply, and a bounce is possible.
RSI is particularly useful for spotting when a share has run too far, too fast — a moment to pause before buying, even if the fundamentals look good.
Volume
Volume is simply the number of shares traded during a given period. It is one of the most underappreciated indicators, yet one of the most reliable.
- Rising price on high volume: strong signal. Many buyers are participating, which confirms the move is broadly supported.
- Rising price on low volume: weaker signal. The price is moving up, but few people are behind it — the trend may be running out of steam.
- A sharp move on heavy volume (either direction) often marks an important moment on the chart, such as a breakout through resistance or a collapse through support.
Does technical analysis actually work?
This is a fair question, and the honest answer is: sometimes, in some markets, for some time horizons — but it is a probabilistic tool, not a crystal ball. Understanding its limits is as important as understanding how to use it.
Technical analysis works best in large, liquid markets with many active participants. FTSE 100 companies qualify — they are among the most traded shares in Europe, which means charts reflect genuine supply and demand. In smaller, thinly traded markets, chart patterns are less meaningful because a single large trade can distort the picture.
The self-fulfilling element is real: support and resistance levels partly hold because millions of traders are watching the same charts and acting on the same levels simultaneously. The pattern becomes true partly because people believe in it and act accordingly.
However, technical analysis has clear weaknesses. It cannot predict company news — profit warnings, CEO resignations, takeover bids, or any earnings surprise will override any chart pattern instantly. Fundamental shifts in a business are invisible to a chart until after the price has already moved. For a broader view of how uncertainty affects returns, see our article on risk and reward.
The practical conclusion: use technical analysis as a complement to fundamental research, not a replacement for it.
How can you use technical analysis in the Student Investor Challenge?
The Challenge gives you a virtual £100,000 to invest in real FTSE-listed companies in your Active portfolio. Technical analysis fits naturally into this process as a final check before you commit.
- Check the trend first. Before buying a share you like fundamentally, glance at its six-month chart. Is it in an uptrend, downtrend, or sideways pattern? Avoid adding shares that are clearly trending downward — you may be right about the company eventually, but swimming against the current costs performance in the short run.
- Look at support and resistance. Is the current price near a support level (potential upside if it holds) or close to resistance (a ceiling that may limit near-term gains)? Buying near support gives you a clearer idea of where the price might find a floor if it falls further.
- Check the RSI before buying after a big run-up. A share that has already surged 20% in a month and has an RSI above 70 may be overbought. Waiting for a small pullback is often better than chasing a share at its peak.
- Watch volume around results announcements. A share that surges strongly on heavy volume after earnings is more likely to sustain the move than one that drifts up on thin trading.
Remember: in the Challenge, your long-term picks should be grounded in fundamental research — earnings, sector outlook, valuation. Technical analysis helps you refine the timing of when you add or reduce a position, not the underlying decision of what to own.
Frequently asked questions
Is technical analysis suitable for complete beginners?
Yes — the basics (trend direction, support and resistance, RSI) can be learned in an afternoon. You do not need maths beyond simple averages. Start with line charts to spot the overall trend, then add candlesticks once you are comfortable reading bodies and wicks.
What is the most important indicator for a beginner?
The 50-day moving average is a good starting point — it is widely watched, easy to understand, and available on any free charting tool. Combine it with RSI to get a sense of both trend direction and momentum together, and you have a solid two-indicator toolkit.
Can I use technical analysis in the Student Investor Challenge?
Yes. While the Challenge rewards sound fundamental research, checking a share’s chart before you buy helps you avoid obvious downtrends and time your entry more sensibly. Think of technical analysis as a second opinion on a trade you are already considering on fundamental grounds — not as the primary reason to buy or sell.
What is the difference between a support level and a resistance level?
Support is a price floor — a level where buyers have repeatedly stepped in and stopped a share from falling further. Resistance is a price ceiling — a level where sellers regularly appear and cap further rises. These levels form because many traders watch the same chart and act on the same price points, making the pattern self-reinforcing.
Do professional fund managers use technical analysis?
Most long-term fund managers rely primarily on fundamental analysis, but many use technical analysis to decide when to execute a trade, even if fundamental research told them what to buy. Short-term traders and quantitative funds use it heavily. It is most widely used in currency and commodity markets, where there are fewer “fundamentals” in the traditional sense.
This article is educational and is not financial advice. Technical analysis is one tool among many, and past price patterns do not guarantee future results. Never make real investment decisions based solely on charts.
Put it into practice
Build a virtual £100,000 portfolio and see how charts and fundamentals work together in real time.
See how it works