UK GDP grew 0.4% in spring — what it means for your shares
The Office for National Statistics confirmed on 13 August 2026 that the UK economy expanded 0.4% in the second quarter of the year, slower than the 0.6% recorded in Q1. Here is what GDP is, what that slowdown signals, and how it connects to the shares in your portfolio.
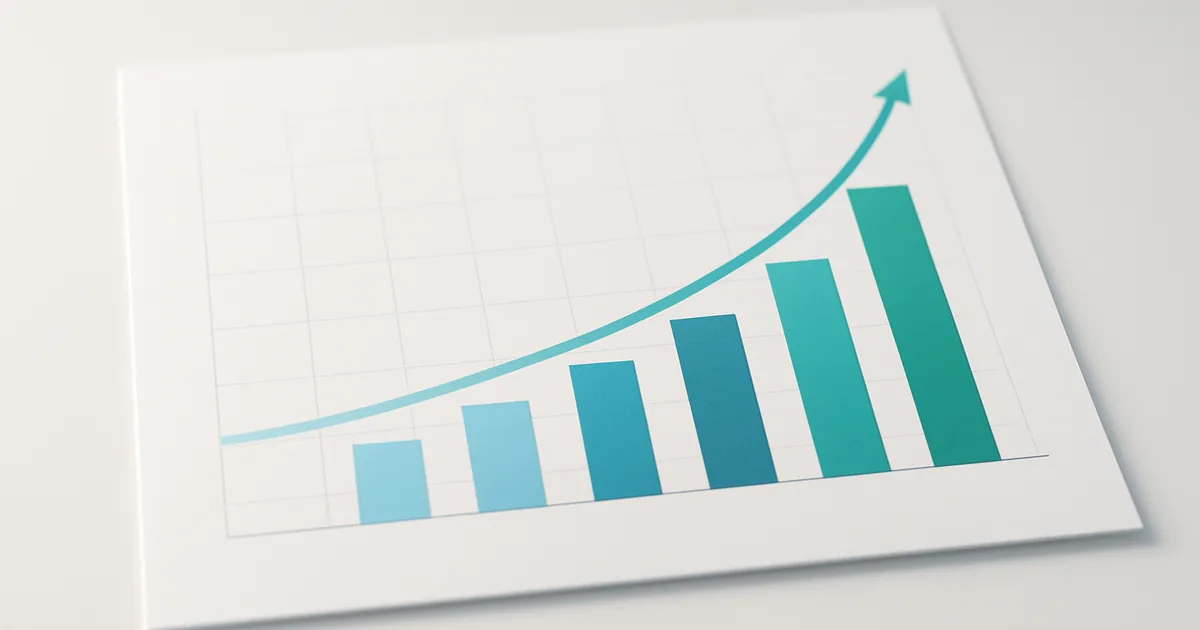
Every quarter, the Office for National Statistics publishes a number that sits behind almost every major decision a central bank makes, a government announces, or a boardroom considers: GDP. When the ONS published its first quarterly estimate for April to June 2026 on 13 August, it showed the UK economy had grown 0.4% — positive, but slower than before. For investors, the headline number is only the beginning of what this data tells you.
What GDP actually measures
Gross Domestic Product, or GDP, is the total monetary value of all goods and services produced within a country in a given period. Every car manufactured in Sunderland, every haircut given in Bristol, every software licence sold from an office in Edinburgh counts. GDP is measured three ways — by output, by expenditure, and by income — and the ONS publishes all three, though they are designed to arrive at the same overall figure.
When economists say the economy “grew 0.4%” in Q2, they mean the total value of what the UK produced between April and June was 0.4% higher than in January to March. GDP is reported as a percentage change rather than an absolute number because it is the rate of growth, or contraction, that matters most for assessing the health of an economy at any given moment.
To put the figure in context: on an annual basis, the UK economy was 1.2% larger in Q2 2026 than in Q2 2025 — a similar pace to the year before, and consistent with an economy that is growing but not rapidly accelerating.
Breaking down the Q2 2026 figures
The headline 0.4% masks some interesting movements within the quarter. According to the ONS data, GDP fell 0.1% in April, was flat in May (an earlier estimate of 0.1% growth was revised down), and then bounced back by 0.3% in June. The quarter effectively started softly and recovered towards the end.
| Month | GDP change (m/m) |
|---|---|
| April 2026 | −0.1% |
| May 2026 | 0.0% (revised) |
| June 2026 | +0.3% |
| Q2 2026 total | +0.4% |
The sector driving most of the growth was services, which expanded 0.5% across the quarter. Services make up roughly 80% of the UK economy — everything from financial services and retail to education, healthcare, and professional services. When services grow, the headline GDP number follows. Manufacturing and construction provided a more modest contribution in Q2, reflecting ongoing cost pressures in those sectors.
Why the pace of growth matters, not just the direction
A common question when GDP data lands is: “The economy grew, so why are investors treating it cautiously?” The answer is that markets are not just asking whether the economy grew — they are asking whether it grew faster or slower than expected, and whether the trend is accelerating or decelerating.
The Q1 2026 reading was 0.6%. The Q2 2026 reading is 0.4%. Growth is still positive, but the pace has moderated. That deceleration — not the absolute number — is what shifts investor sentiment.
It is worth being precise here: slower growth is not a recession. A recession is defined as two consecutive quarters of negative GDP — the economy actually shrinking rather than growing more slowly. The UK is nowhere near that threshold at present. But a trend of decelerating growth does raise legitimate questions: Will businesses invest as freely? Will consumers spend as confidently? Will company profits face more headwinds?
Those questions are what ripple through share prices when a GDP reading comes in below expectations or below the previous quarter.
GDP and the Bank of England: the rate connection
One of the most direct channels from GDP data to share prices runs through interest rates. The Bank of England is tasked with controlling inflation while supporting growth. When it sets the base rate, it is balancing two concerns: if it raises rates too high, it risks choking off the growth needed to keep businesses profitable and workers employed; if it keeps rates too low, it risks stoking inflation.
GDP data is one of the inputs the Bank’s Monetary Policy Committee reviews at every meeting. A stronger-than-expected GDP reading can give the MPC more confidence to raise rates, because the economy appears able to absorb the cost. A weaker-than-expected reading — or a trend of slowing growth — can give the MPC pause. Investors follow this logic closely, which is why a 0.4% GDP print, slightly below some forecasts, can nudge expectations about the Bank’s next move.
In August 2026, with UK CPI running at 2.9% and well above the Bank’s 2% target, the MPC is already in a difficult position. GDP data showing growth moderating adds another variable to an already complex decision.
What slowing growth means for different types of shares
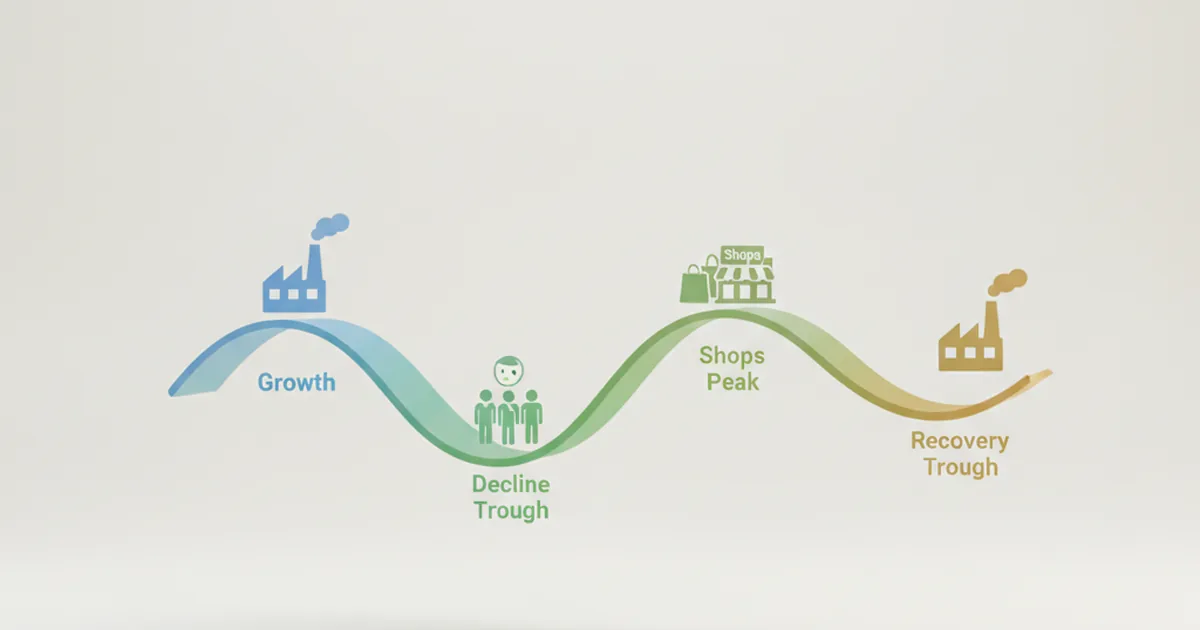
Not every company is equally affected by a slowdown in economic growth. Understanding the difference between cyclical and defensive businesses is one of the most useful frameworks an investor can apply when GDP data moves markets.
Cyclical companies
Cyclical businesses are ones whose revenues rise and fall with the economic cycle. When GDP is growing fast, consumers and businesses spend more freely, and cyclical companies benefit the most. When growth slows, those same companies feel it first. Examples include:
- Retailers selling non-essential goods (clothing, electronics, leisure products)
- Housebuilders — people buy fewer homes when confidence is lower
- Travel and hospitality companies
- Banks (to a degree) — fewer loans taken out, more defaults if incomes fall
Defensive companies
Defensive businesses offer products and services people need regardless of the economic weather. Their revenues tend to be more stable, which makes their shares less sensitive to GDP swings. Examples include:
- Utilities — electricity, gas, and water providers
- Supermarkets and essential food retailers
- Healthcare and pharmaceuticals
- Tobacco and consumer staples
When GDP data comes in soft, or when investors start worrying about future growth, money often rotates out of cyclical shares and into defensives. That rotation is one of the practical mechanisms by which a GDP release — a single government statistic — produces real movements in individual company share prices on the same day.
Reading GDP data like an investor
Professional investors do not simply look at whether the GDP number is positive or negative. They ask a series of more precise questions:
- How does the reading compare to the forecast? Economist consensus estimates are available before data is published. A reading that beats consensus is a positive surprise; one that misses is a negative one, even if the absolute number is still fine.
- Which sectors drove the result? A services-led expansion tells a different story than a manufacturing-led one, particularly in the UK where services account for most of economic output. Investors in manufacturing-heavy companies pay close attention to the sector breakdowns.
- Is the trend accelerating or decelerating? The direction of travel matters as much as the number itself. Q1 at 0.6%, Q2 at 0.4% — the economy is growing, but the momentum is fading. Investors build that trajectory into their expectations for future earnings.
- What does it imply for the Bank of England? Every GDP release feeds into the market’s view of where interest rates are headed. Rate expectations, in turn, affect everything from mortgage costs to corporate borrowing to the valuation of income-generating shares.
What this means in the Student Investor Challenge
When GDP data lands, a useful exercise for any Challenge participant is to scan their virtual portfolio and ask: “How many of my companies are cyclical, and how many are defensive?”
A portfolio of pure cyclicals — retailers, housebuilders, travel companies — may perform brilliantly when the economy is accelerating and face more pressure when growth moderates. A more balanced portfolio that includes some defensive holdings can absorb GDP weakness more smoothly, even if it captures less of the upside in a boom.
This does not mean defensive shares are always the right call. In a strongly growing economy, an overly defensive portfolio can lag behind the wider market. The skill is in reading which phase of the economic cycle is most likely and positioning your portfolio accordingly — which is exactly the kind of thinking that separates a considered investment strategy from guesswork.
GDP data, released each quarter by the ONS, is one of the most useful inputs for making that judgement. Q2 2026’s 0.4% reading tells you the UK is still growing, but the pace has eased. For students running a portfolio in the Challenge, that is a signal worth sitting with rather than ignoring.
FAQ
What does UK GDP growing 0.4% in Q2 2026 actually mean?
It means the total value of goods and services produced in the UK between April and June 2026 was 0.4% higher than in January to March 2026. Growth was positive — the economy expanded — but the pace slowed compared with the 0.6% recorded in Q1. On an annual basis, the economy was 1.2% larger than a year earlier.
Does slower GDP growth mean the UK is heading for a recession?
Not on its own. A recession is technically defined as two consecutive quarters of negative GDP growth — the economy actually shrinking. In Q2 2026, the UK economy grew; it simply grew more slowly. Slowing growth is a signal worth monitoring, but it is a very different condition from a recession. You can read more about what a recession actually means in our recession explainer.
Why do share prices react to GDP data?
GDP gives investors a broad view of how much companies across the economy are earning. Strong growth supports profits; slowing growth raises the question of whether revenues will follow. The data also feeds into Bank of England rate decisions, which affect borrowing costs for businesses and households — and therefore how much money is available for investment and spending. That chain is why a single government statistic can move dozens of share prices on the same morning.
Learn it by playing it
Build a virtual £100,000 portfolio and see how economic data moves real companies.
See how it works