What is a balance sheet?
While the income statement shows how much money a company made over a period, and the cash flow statement shows where cash came from and went, the balance sheet does something different: it takes a photograph of the company’s finances on one specific day. Everything it owns, everything it owes, and what is left for shareholders — all on a single page.
Every listed company publishes three core financial statements: the income statement, the cash flow statement, and the balance sheet. You have already met revenue and profit through the income statement, and seen how cash generation differs from reported profit. The balance sheet is the third piece of the puzzle — and arguably the most revealing. Once you know how to read it, you can assess a company’s financial health in a way that goes far beyond the headline profit figure.
The three-statement model
Think of a company’s financial life in terms of two videos and one photograph.
- The income statement is the first video. It covers a period — usually six or twelve months — and shows how much revenue the company generated, what it spent, and how much profit remained. It answers: “How well did this business perform lately?”
- The cash flow statement is the second video, covering the same period. It tracks every pound of real money coming in and going out: from customers, to suppliers, through investments, through borrowing and repayments. It answers: “Is the business generating real cash?”
- The balance sheet is the photograph. It captures a single moment in time — typically the last day of the company’s financial year — and lists every asset the company owns and every liability it owes. It answers: “What is the financial position of this business right now?”
The balance sheet is essentially the accumulated result of all the company’s past trading decisions. Every profit made, every debt taken on, every asset purchased and depreciated — all of it is captured in the balance sheet on any given date. This is why experienced investors always read the income statement and the balance sheet together: one tells you how the business is performing; the other tells you what the business is built on.
The two sides of a balance sheet
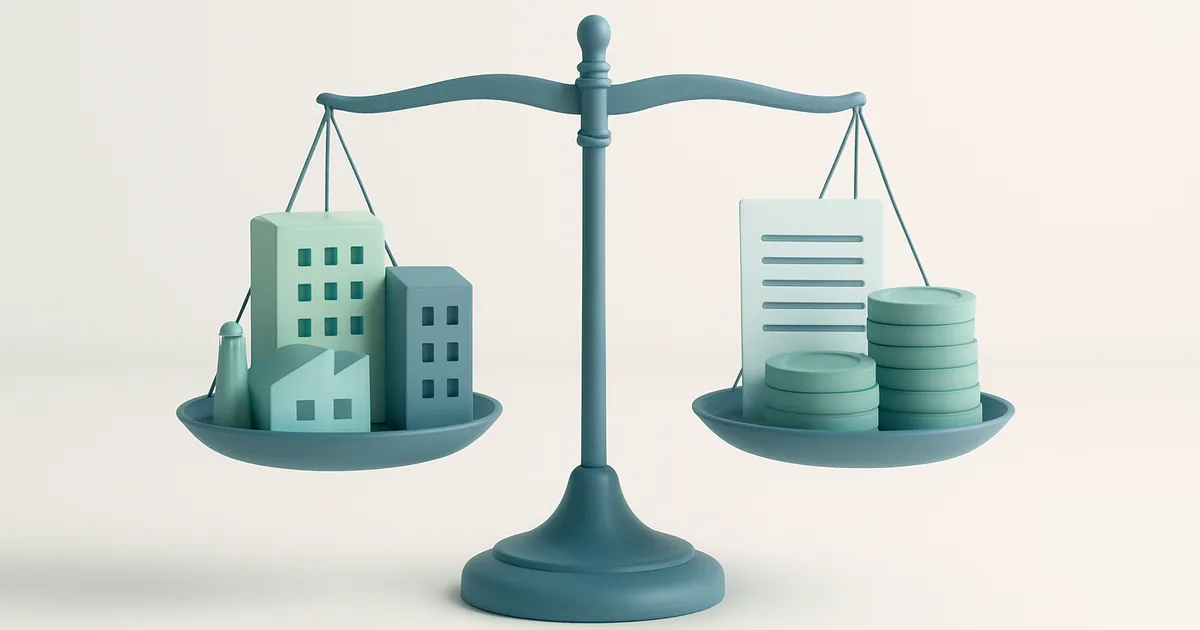
A balance sheet is split into two halves, and the fundamental rule of accounting — known as the accounting equation — says these two halves must always balance:
Assets = Liabilities + Shareholders’ Equity
In other words: everything a company owns must have been paid for somehow — either by borrowing money (a liability) or by shareholders’ investment and retained profit (equity). The two sides always balance, by definition. This is the foundation of double-entry bookkeeping and cannot be violated.
Assets — what the company owns
Assets are everything a company controls that has economic value. They are divided into two groups depending on how quickly they can be turned into cash.
| Type | What it includes | Examples |
|---|---|---|
| Current assets | Can be converted to cash within 12 months | Cash and bank balances, trade receivables (money owed by customers), inventory/stock, short-term investments |
| Non-current (fixed) assets | Held for more than 12 months; not easily sold quickly | Property, plant and equipment (PP&E), machinery, vehicles, intangible assets (patents, trademarks), goodwill |
Working capital is a concept closely tied to current assets. It is defined as current assets minus current liabilities (see below), and it tells you whether a company can comfortably meet its short-term obligations. A business with plenty of working capital is in a more comfortable day-to-day position than one where current liabilities threaten to exceed current assets.
Liabilities — what the company owes
Liabilities are all the company’s financial obligations — amounts it must pay to lenders, suppliers, employees, or other parties. Like assets, they are split by time horizon.
| Type | What it includes | Examples |
|---|---|---|
| Current liabilities | Due within 12 months | Trade payables (money owed to suppliers), short-term borrowings, accruals, corporation tax due |
| Non-current liabilities | Due in more than 12 months | Long-term debt and bonds, pension obligations, deferred tax liabilities, lease commitments |
Long-term debt is the liability that investors watch most closely. A company carrying a heavy load of bonds or bank loans relative to its assets is described as leveraged. Leverage amplifies returns in good times — but it amplifies losses in bad times too, because interest payments must be made regardless of how the business is performing.
Shareholders’ equity — the residual
Once you subtract all liabilities from all assets, what remains belongs to shareholders. This is called shareholders’ equity (sometimes stockholders’ equity or net assets). It is made up of three main components:
- Share capital: the amount originally invested by shareholders when shares were issued.
- Retained earnings: cumulative profits that have been kept in the business rather than paid out as dividends. This grows every year when the company makes a profit and retains it.
- Reserves: other components such as revaluation reserves (if assets have been revalued upwards) or currency translation adjustments for international businesses.
In a profitable, growing business that reinvests its earnings, shareholders’ equity tends to rise steadily over time. In a business that consistently loses money or takes on more debt, equity can shrink — and in extreme cases, become negative, which is a serious warning sign.
The balance sheet equation in action
Let us use a fictional UK company — Ridgeway Manufacturing plc — to see how the accounting equation works in practice. All figures are illustrative and simplified.
| Item | Amount |
|---|---|
| Assets | |
| Property, plant and equipment | £120m |
| Inventory (stock) | £30m |
| Trade receivables | £25m |
| Cash | £25m |
| Total assets | £200m |
| Liabilities | |
| Long-term bank debt | £60m |
| Trade payables | £20m |
| Other current liabilities | £10m |
| Total liabilities | £90m |
| Shareholders’ equity | £110m |
| Check: liabilities + equity | £90m + £110m = £200m ✓ |
The equation balances exactly. Ridgeway owns £200m in assets. Those assets were funded by £90m of borrowing and obligations (liabilities) and £110m of shareholders’ money (equity). The equity of £110m is the “cushion” between what the company owns and what it owes — the bigger that cushion, the more financial resilience the company has.
What investors look for in a balance sheet
Reading a balance sheet is not just about checking that the numbers add up — it is about assessing what the numbers reveal about financial health and risk.
Debt levels and the debt-to-equity ratio. This is calculated by dividing total debt by shareholders’ equity. A ratio of 1.0 means the company owes as much as shareholders have put in. Higher ratios signal greater leverage and, therefore, greater financial risk in a downturn. There is no single “right” ratio — it varies hugely by industry — but a sudden jump in the ratio deserves attention.
The current ratio. Calculated as current assets divided by current liabilities, this tells you whether the company can cover its near-term bills. A ratio above 1.0 means current assets exceed current liabilities — generally reassuring. A ratio below 1.0 means the company may struggle to meet short-term obligations without raising cash or selling assets.
Net asset value (book value) per share. Dividing total shareholders’ equity by the number of shares outstanding gives a “book value” per share — the theoretical amount each share is backed by on paper. Comparing this to the market price tells you whether the market is valuing the company at a premium or a discount to its net assets. Alongside the balance sheet, earnings per share and cash flow complete the picture of value.
Goodwill. When a company acquires another business for more than the fair value of its identifiable assets, the excess is recorded as goodwill on the balance sheet. A large goodwill figure from multiple acquisitions is worth watching: if an acquisition disappoints, the company may need to write down (impair) the goodwill, which reduces reported equity immediately. Impairment charges can be significant and come as an unpleasant surprise in results announcements.
Where to find a balance sheet in the Challenge
When you are researching a share for the Student Investor Challenge, you will find the balance sheet in the company’s annual report. It is usually titled “Consolidated Statement of Financial Position” — the modern accounting term for a balance sheet. Here is where to look:
- Company investor relations pages. Listed companies publish their annual reports on their own websites, usually under “Investors” or “Investor Relations.”
- RNS filings on the London Stock Exchange. Results announcements are filed through the Regulatory News Service. You can find these via the London Stock Exchange company filings pages, the same source used for results announcements and trading updates.
- Companies House. For smaller or less prominent companies, full accounts are available free of charge from Companies House, the official UK register of companies. All UK companies are legally required to file accounts, including a balance sheet, each year.
Make it a habit to read the balance sheet alongside the income statement. A company with impressive revenue growth but rapidly rising debt deserves more scrutiny than one growing more modestly with a clean, conservatively financed balance sheet. For a broader guide to the research process, read our piece on how to research a share before you add it to your portfolio.
A quick example — spotting a strong and a weak balance sheet
To make this concrete, here are two fictional companies — Fairview Retail plc and Castleton Group plc — both reporting the same revenue. Their balance sheets tell very different stories.
| Fairview Retail plc | Castleton Group plc | |
|---|---|---|
| Total assets | £200m | £500m |
| Total liabilities | £50m | £470m |
| Shareholders’ equity | £150m | £30m |
| Current assets | £80m | £90m |
| Current liabilities | £30m | £120m |
| Current ratio | 2.7 | 0.75 |
| Debt-to-equity ratio | 0.3 | 15.7 |
| Financial profile | Conservative, resilient | Heavily leveraged, fragile |
Castleton looks impressive at first glance — its balance sheet is much larger. But the vast majority of those assets are funded by debt. Its current liabilities exceed current assets, meaning it may struggle to pay near-term bills. One bad quarter, a rise in interest rates, or a credit market disruption could put Castleton under serious pressure. Fairview, by contrast, could absorb a prolonged downturn with far greater ease. Size of balance sheet is not the point — the structure of that balance sheet is what matters.
Frequently asked questions
Is a big balance sheet always better?
Not necessarily. A larger balance sheet simply means more total assets and liabilities. What matters is the ratio — how much of those assets are funded by debt versus shareholder equity. A company with £500m in assets but £480m in debt is far more fragile than one with £200m in assets and £50m in debt. Size alone tells you very little; structure is everything.
What is the difference between a balance sheet and a profit and loss account?
The profit and loss (income) statement covers a period — it shows what a company earned and spent over six or twelve months. The balance sheet is a snapshot on a single date, typically the last day of the financial year. One shows flow, the other shows stock. Both are required for a complete picture; neither replaces the other.
Why does goodwill appear on a balance sheet?
Goodwill is created when a company pays more to acquire another business than the fair value of its identifiable assets. If a company pays £300m to buy a business whose physical and other identifiable assets are worth £200m, £100m appears as goodwill on the balance sheet — reflecting the value attributed to the brand, customer base, or workforce that was acquired. Goodwill can be “impaired” (written down) if the acquisition disappoints, which immediately reduces reported equity and can make results announcements very uncomfortable reading.
Put it into practice
Apply these concepts with a virtual £100,000 portfolio — no real money, real companies, real results announcements.
See how it works