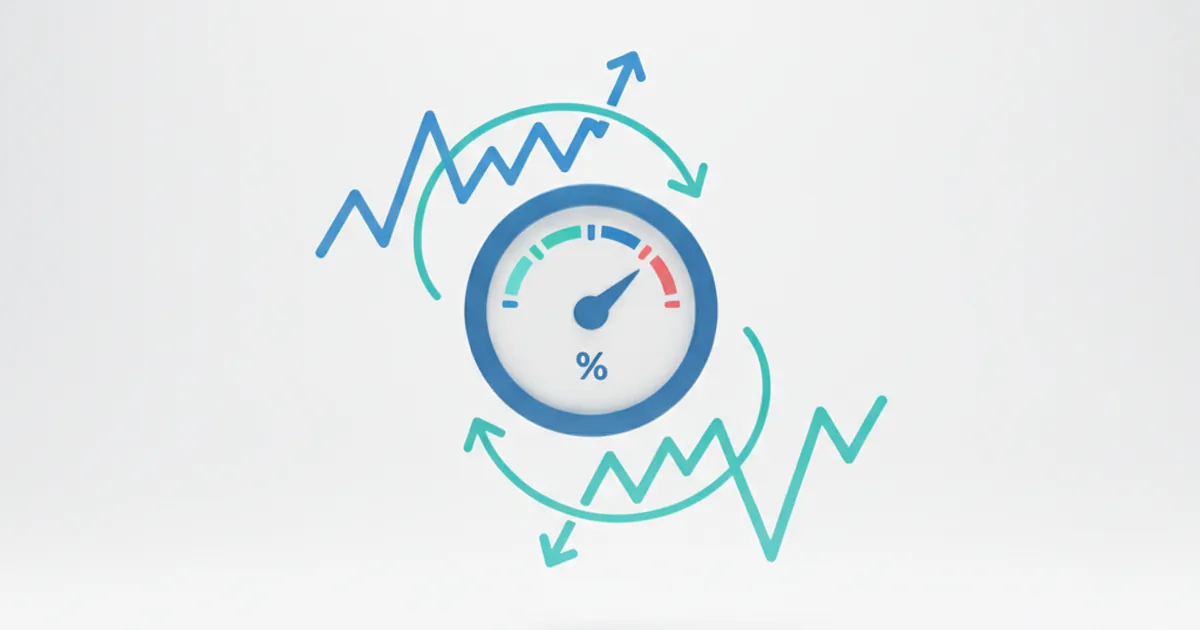
Why the US inflation report moves markets
On 12 August 2026, the US Bureau of Labor Statistics published the latest reading of American inflation: prices rose 3.4% over the past year, easing from 3.5% in June. That single number, released at 8:30 am Eastern time, was enough to move share prices around the world. Here is why — and what it teaches every Student Investor about how markets actually work.

Every month, on a date announced months in advance, one of the most closely watched documents in the financial world is published: the US Consumer Price Index report. Traders set alerts for it. Newspapers dedicate front pages to it. Share prices, currencies and interest-rate bets can all shift sharply in the minutes after it lands. And yet, for anyone new to investing, it is not immediately obvious why a simple percentage number should matter that much. If you have ever wondered what all the fuss is about, this is the article for you.
What is the Consumer Price Index?
The Consumer Price Index, or CPI, is a measure of how the prices of everyday goods and services change from one month to the next. The US Bureau of Labor Statistics tracks the cost of a carefully chosen basket of items that a typical American household buys: food at the supermarket, petrol, electricity bills, rent, clothing, healthcare and so on. Every month it calculates how much that basket costs in total. The inflation rate you see in the headlines is simply how much more expensive the basket is compared with the same month a year ago.
For July 2026, the Bureau of Labor Statistics reported that headline inflation came in at 3.4%, easing from 3.5% in June. Core inflation — which strips out volatile food and energy prices to give a steadier underlying picture — eased to 2.5% annually. A fall in petrol prices, down roughly 3% over the month, was the main driver of the cooling headline figure.
That might sound like a modest change: one tenth of a percentage point on the headline. But in a world where investors try to read the future in every data point, even a small shift in the direction of travel matters enormously. June itself had already been a positive surprise — inflation fell from 4.2% in May to 3.5%, beating forecasts — so a second consecutive monthly improvement told a consistent story: prices are cooling.
Why do markets watch this so closely?
To understand the market reaction you need to understand who is reading this report at 8:30 am with the most at stake: the Federal Reserve.
The Fed is the central bank of the United States — the institution that sets the key interest rate for the world’s largest economy. Its mandate is to keep inflation near 2% over time while supporting employment. When inflation is too high, the Fed raises interest rates to cool spending. When it falls back towards target, the Fed can leave rates where they are or eventually cut them.
As we explored in what interest rates do to shares, interest rates have a direct chain of effects on every share price in the market. Lower rates make it cheaper for companies to borrow and invest, and they make shares look more attractive relative to savings accounts and bonds that pay less interest. Higher rates do the opposite. So anything that changes the picture of where rates are heading will move share prices — and the monthly CPI report is the single most important data point the Fed watches when deciding what to do next.
The chain from price data to share prices
Here is the chain that runs from a CPI number to a move in your virtual portfolio:
- Inflation data lands. The Bureau of Labor Statistics publishes the monthly CPI reading at 8:30 am ET. Traders analyse it instantly — not just the headline figure but the breakdown by category, the month-on-month change and how it compares to economists’ forecasts.
- Rate expectations shift. If inflation is cooling, investors revise their expectations for what the Fed will do at its next meeting. Markets use instruments called “Fed funds futures” to price the probability of rate rises or cuts. A softer inflation print typically lowers the odds of a rate rise and can raise the odds of a future cut.
- Bonds react first. Government bond yields move quickly in response because bonds are directly priced off interest rate expectations. When fewer rate rises are expected, bond yields fall — which is good news for existing bondholders but also signals cheaper borrowing ahead.
- Shares follow. As borrowing looks cheaper and the outlook for company profits brightens, investors shift money into shares. The effect is often seen within minutes of the data release, though it can take longer to settle as traders digest the details.
On 12 August 2026, with inflation continuing to cool and petrol prices pulling the headline lower, the reaction followed this pattern. A second consecutive monthly improvement provided confidence that price pressures were easing in a sustained way — not just a one-off blip.
Why core inflation gets its own number
You will often hear analysts talk about “headline” and “core” inflation as though they are two different stories. They are, in a sense.
Petrol prices can swing by 10% in a month because of decisions made in Riyadh or an unexpected tropical storm in the Gulf of Mexico. Food prices can jump because of drought in one farming region. Neither of those is really a sign that the underlying economy is overheating — they are just volatile commodity markets doing what volatile commodity markets do. Strip those two categories out and you get core inflation: a smoother, stickier reading that tells you whether prices are rising more broadly across the economy.
In July 2026, core CPI eased to 2.5% annually. That matters because it suggests underlying inflationary pressures — things like services, rent and wages — are also moderating, not just energy prices. The Fed pays close attention to core because it is harder to reverse. A core figure that keeps drifting down towards the 2% target is a much stronger signal than a headline fall driven purely by cheaper petrol.
The bigger picture: from 4.2% to 3.4% in two months
To put July’s reading in context, US inflation was running at 4.2% in May 2026 — more than double the Fed’s target. Then June came in at 3.5%, and now July is at 3.4%. That is a significant cooling over a short period, and it tells investors something important: the combination of higher interest rates and slower spending is doing its job.
This is not a one-country story either. As we saw with the July jobs report, every major US data release ripples outward. The FTSE 100 in London, the CAC 40 in Paris and the Nikkei in Tokyo all react to American inflation data because so much of the global financial system is priced in US dollars, and because what the Fed does next with rates affects borrowing costs and currency values far beyond American shores.
For UK investors, there is also a domestic parallel. The Bank of England has its own inflation target of 2% and makes its rate decisions partly with one eye on what the Fed is doing. UK inflation is currently running at 2.6%, above the Bank’s target — which is part of why the MPC voted to hold rates steady at its July 2026 meeting, with three members pushing for a rise. Understanding US CPI helps you make sense of those British headlines too.
What this means when you are playing the Challenge
In the Student Investor Challenge, your virtual £100,000 portfolio is exposed to exactly the same price movements driven by these data releases. When the CPI lands, sector by sector the market reprices.
A few things to watch when the next inflation report arrives:
- Which sectors move most? Growth companies — especially in technology — tend to react most strongly to rate expectations because their value depends heavily on distant future profits. Banks can move in the opposite direction: higher rates often help bank profits. Energy companies are directly tied to the oil price that drove headline inflation.
- Compare actual to forecast, not just to last month. The market knows roughly what to expect. If economists forecast 3.4% and the report comes in at 3.4%, you might see little reaction at all — the number was already “priced in”. The surprise is what moves prices.
- Watch the core figure as closely as the headline. A falling headline driven purely by cheap petrol is less reassuring than falling core inflation. Analysts will pick the report apart quickly; the initial market move and the settle-point an hour later can tell quite different stories.
None of this is a cue to buy or sell anything in your virtual portfolio — you learn the Challenge by managing your strategy across weeks and months, not by trading on data-release days. But being able to explain why the market moved on an inflation report morning puts you well ahead of most first-year economics students.
The takeaway
The Consumer Price Index is a monthly snapshot of how much more or less everyday life is costing American households. Its power over financial markets comes from a chain: CPI data shapes expectations about what the Federal Reserve will do with interest rates, rate expectations move bond yields, and bond yields pull share prices behind them. On 12 August 2026, US inflation eased for the second month in a row to 3.4%, with petrol prices and cooling core pressures leading the way. Markets do not just react to the number itself — they react to what the number implies about the future. Learning to think in those chains is one of the most useful skills you can bring to the Challenge — and to a career in finance.
Frequently asked questions
What is the Consumer Price Index (CPI)?
The CPI is a measure of how much a fixed basket of everyday goods and services — food, energy, rent, clothing and more — costs compared with the same month a year ago. The percentage change is the inflation rate. In the US, the Bureau of Labor Statistics publishes it monthly. This is education, not financial advice.
What is core inflation and why does it get its own number?
Core inflation strips out food and energy prices because they swing sharply due to seasonal and commodity-market factors that can reverse quickly. What remains gives a steadier picture of whether prices are rising broadly and persistently. Central banks typically focus on core inflation when setting rates. This is education, not financial advice.
Why does the inflation report move share prices?
Inflation data shapes market expectations about what the central bank will do with interest rates. Lower-than-expected inflation suggests the central bank may hold or cut rates, which makes borrowing cheaper for companies and shares more attractive than bonds. Higher-than-expected inflation can trigger the opposite reaction. This is education, not financial advice.
What is the Federal Reserve and why does it matter for UK investors?
The Federal Reserve is the US central bank. It sets a key rate that ripples through global financial markets, affecting borrowing costs, currency values and share prices worldwide — including in the UK. Because the US economy is the world’s largest, its rate decisions matter for every investor, wherever they are. This is education, not financial advice.
This article is educational and is not financial advice. CPI data from the US Bureau of Labor Statistics; July 2026 figures and market reaction reported by Trading Economics, 12 August 2026. UK inflation and Bank of England context from SalaryWise.
Learn it by playing it
Build a virtual £100,000 portfolio and watch how inflation data, rate decisions and real market events move share prices day by day.
See how it works