What Is an Income Statement?
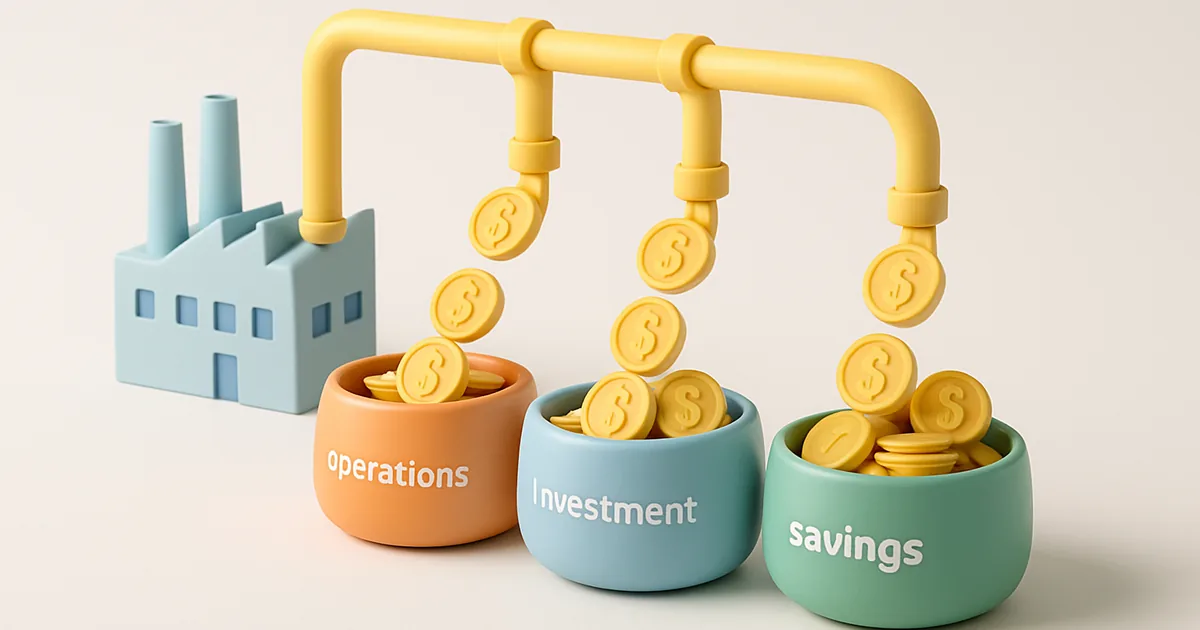
When a company announces its results, the income statement is the first document investors turn to. It tells the story of how a business performed over a period — how much it sold, what it spent, and whether any money was left over. Understanding it is the foundation of analysing any share in the Student Investor Challenge.
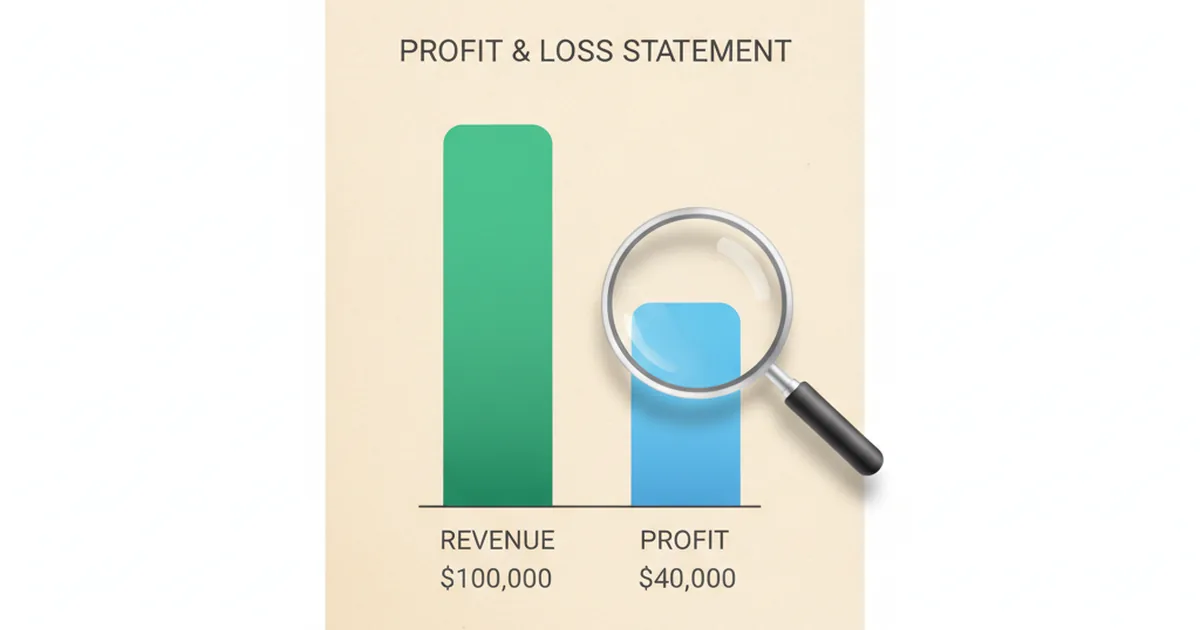
Every listed company publishes three core financial statements. The cash flow statement tracks real money moving in and out of the business. The balance sheet photographs the company’s financial position on a single day. The income statement — sometimes called the profit and loss account, or P&L — covers the ground between those two: it shows how the business performed over a period, usually the past six or twelve months. If you want to know whether a company is making or losing money, and how quickly its profits are growing, this is the document you read first.
The income statement in plain English
An income statement is a summary of a company’s trading activity over a defined period. It starts at the top with everything the company earned from selling its goods or services — the revenue, sometimes called turnover — and works its way down, subtracting costs one layer at a time, until only the profit (or loss) remains at the bottom. That final number is why investors talk about the “bottom line.”
In the UK, older companies and private businesses often call this document the profit and loss account. Listed companies following International Financial Reporting Standards (IFRS) — which includes every company on the FTSE — call it the income statement or statement of comprehensive income. Different name, same document.
The key difference from the balance sheet is timing. The balance sheet shows one moment; the income statement shows a journey. A company might have a strong balance sheet and a terrible income statement, or vice versa. Reading both together gives you a complete picture.
The four key lines every income statement has
1. Revenue — what the company sold
Revenue is the total value of everything the company sold during the period, before any costs are deducted. You may also see it labelled as turnover or sales. A supermarket’s revenue is the sum of every item scanned at the till. A software company’s revenue is the total of its subscription fees and licences. Revenue is the starting point: the bigger it is, and the faster it is growing, the more room a company has to generate profit.
2. Cost of sales — what it cost to produce
Cost of sales (also called cost of goods sold, or COGS) represents the direct costs of producing whatever was sold. For a manufacturer, this is raw materials and factory labour. For a retailer, it is the wholesale cost of the stock that was shifted. Subtracting cost of sales from revenue gives gross profit — the first profit figure on the statement and a measure of how efficiently the company makes its product.
The ratio of gross profit to revenue is the gross margin. A company earning £70m gross profit on £200m revenue has a 35% gross margin. Tracking this margin over time tells you whether the business is getting more or less efficient at what it actually does. You can explore this further in our piece on profit margins.
3. Operating costs — running the business
Below gross profit comes a second layer of costs: the overheads that keep the business running regardless of how much is sold. These are called operating costs or operating expenses, and they typically include:
- Staff wages and salaries (outside the factory or warehouse)
- Rent, rates, and utilities for offices and shops
- Marketing and advertising spend
- Depreciation — the gradual “using up” of equipment and buildings
- Research and development spending
Subtracting operating costs from gross profit gives operating profit (sometimes called EBIT — earnings before interest and tax). This figure is important because it shows how much money the core business generates before financial costs enter the picture.
4. Net profit — the bottom line
After operating profit, the income statement deducts interest payments on debt and corporation tax. What remains is net profit (or net income). This is the famous “bottom line” — the true amount the company earned for shareholders during the period. It is from net profit that dividends are paid and from which retained earnings grow on the balance sheet.
A simple example
To make this concrete, here is a fictional UK company — Westbridge Retail plc — showing two years of results side by side. All figures are illustrative.
| Income statement line | Year 1 | Year 2 |
|---|---|---|
| Revenue (turnover) | £200m | £240m |
| Cost of sales | £120m | £150m |
| Gross profit | £80m (40%) | £90m (37.5%) |
| Operating costs | £45m | £58m |
| Net profit | £35m | £32m |
At first glance, Year 2 looks better: revenue is up 20%. But look more carefully. Gross margin fell from 40% to 37.5%, meaning costs of producing goods grew faster than sales. Operating costs jumped by nearly 29%. The result? Net profit actually fell from £35m to £32m — a profit warning in all but name. This is exactly the kind of pattern that would cause a company’s share price to fall even as revenues rise.
How it fits with the balance sheet and cash flow statement
The income statement, the balance sheet, and the cash flow statement are three views of the same business. The income statement covers a period and measures profitability. The balance sheet is a snapshot of what the company owns and owes on the last day of that period. The cash flow statement covers the same period as the income statement but tracks actual cash — not accounting profit. A company can report a healthy profit and still run out of cash if customers are slow to pay or if it has invested heavily in new assets. Professional investors always read all three.
How investors use the income statement
When a FTSE company publishes its results, investors are not simply checking whether profits went up. They are looking for signals about the health and direction of the business:
- Revenue growth trend. Is the top line accelerating or slowing? Consistent revenue growth is usually a positive sign, though growth at all costs (by slashing prices, for instance) can destroy margins.
- Margin direction. Are gross and operating margins expanding or compressing? Expanding margins suggest the business is becoming more efficient or gaining pricing power. Compressing margins are a warning sign.
- Profit warnings. If a company tells the market that profits will be below expectations before results are published, that is a profit warning. The share price usually falls immediately. Understanding the income statement is what lets you interpret why.
- Guidance. The income statement covers the past; management guidance covers the future. Investors compare the two: strong past results with cautious future guidance can still cause a share to fall. Find out more in our article on why shares move on company results.
What to watch when a FTSE company reports results
For Student Investor Challenge players, results announcements are some of the most important events in the calendar. Here is where to focus:
- Find the income statement first. In most annual and half-year reports it appears as the “Consolidated Income Statement” or “Consolidated Statement of Comprehensive Income.” It is usually the first table in the financial statements section. You can find results announcements via the London Stock Exchange company pages.
- Compare to the same period last year. Most income statements show two columns: this year and last year. Focus on the rate of change, not just the absolute numbers.
- Check the gross margin line. If revenue is up but gross margin has fallen, management will usually explain why — rising input costs, a promotional push, a new product mix. Decide whether that explanation is convincing.
- Read the narrative alongside the numbers. The income statement tells you what happened; the CEO’s statement and financial review section tells you why, and what management expects next.
Frequently asked questions
Is an income statement the same as a profit and loss account?
Yes. In the UK, “profit and loss account” is the traditional term; “income statement” is the international standard under IFRS. Every listed company on the London Stock Exchange uses income statement in its annual report, but both documents show the same information: revenue, costs, and the resulting profit or loss over a period.
What is the difference between gross profit and net profit?
Gross profit is revenue minus the direct cost of producing or selling a product. It tells you how efficiently the company makes what it sells. Net profit deducts all remaining costs — overheads, rent, wages, interest, and tax — and is the true bottom-line figure. A business can have a healthy gross profit and still report a net loss if its overhead costs are too high.
Where can I find a real income statement for a FTSE company?
All FTSE-listed companies publish their income statements on their investor relations website and on the London Stock Exchange results page. Look for the full-year or half-year results announcement — the income statement is usually the first main financial table in the document.
Can a company have rising revenue but falling profit?
Yes — and it is one of the most common investor traps, as the Westbridge example above shows. If costs rise faster than revenue, the profit margin shrinks even as total sales grow. This is called margin compression and often triggers a profit warning, which can cause a sharp fall in the share price.
Why do shares sometimes fall even when a company reports higher profit?
Because the market prices in expectations, not just results. If analysts forecast £500 million in profit and the company delivers £490 million, that shortfall is treated as a disappointment even though profit is technically higher than last year. This is why reading management guidance alongside the income statement matters — and why understanding earnings season is so useful in the Challenge.
Put it into practice
Apply these concepts with a virtual £100,000 portfolio — no real money, real companies, real results announcements.
See how it works